- Help Center
- Reports
- Reports
-
Log-In Information
-
Software Settings
-
Landing Page Content
-
Items
-
Bidders
-
Event Central
-
Butler
-
Ticket Page
-
EventStream
-
Pre-Event
-
Credit Cards and Merchant Info
-
Reports
-
Virtual Event Resources
-
Frequently Asked Questions
-
Integrations
-
Donations/Text-to-Give
-
Post Event
-
Fundraising Ideas
-
Recurring Donations
-
Renewal
-
Bidder Instructions
-
Removing Data
-
Organization Account
-
Onsite Support
Totals By Tag Report
Reports > Totals by Tag
Follow these instructions to create a report or display chart for the tags you have created under Items or Bidders.
-
Select a Tag Type
-
Bidder
-
Items
-
-
Select a Date Range (optional)
-
Select tags to be included within the Report (must be previously created)
-
All tags created
-
Specific Tags
-
-
Select Categories to Display on the chart
-
Silent Items
-
Live Items
-
Donation Items
-
Quantity Items
-
Combined Totals
-
-
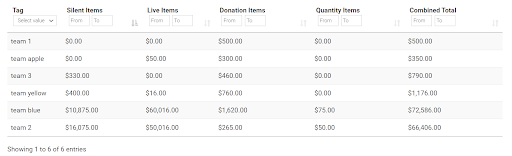
Click ‘Filter Results’ to review a report of the criteria you entered above.
-
This report includes both paid and unpaid sales.
-
-
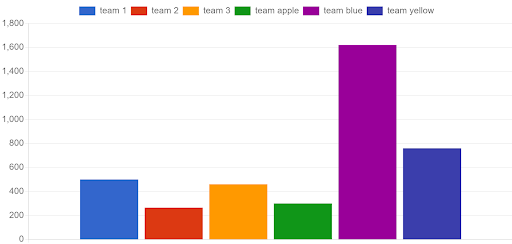
Click ‘Display Chart’ to populate a new browser of the chart based on the tag report.
-
This chart updates every 15 seconds.
-
This chart is super helpful for peer-to-peer campaigns or for organizations that raise money for different charities. Creating a report or visual that shows how much was raised by each tag.
-
-
Click ‘Create Chart Share Link’ to create a shareable link of the Display Chart of the report.
-
Looking to embed this chart on your landing page? Follow this best practice and use the website embed feature. Insert the shareable link as the URL for the ‘website’. Click Here
-
-
Click ‘CSV’ to download a spreadsheet of the tag report. Once downloaded, this report will include all categories of items and both paid and unpaid sales.
Sample Report Screenshot
Sample Chart Screenshot
With all categories selected
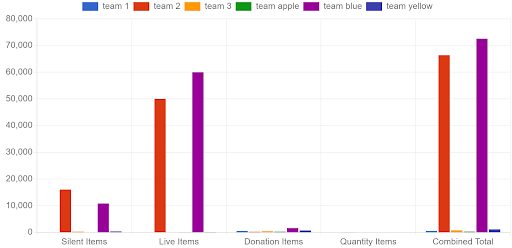
With just one Category selected